Mechanical Engineer Salary in Iowa: $97,781 (2026)
Quick Answer:Across Iowa's 26 metropolitan areas, the average median mechanical engineer pay sits at $97,781/year heading into 2026 — a figure projected from 2025 BLS OEWS wage data for SOC 17-2141. Because Iowa sits at BEA RPP 90.4 (10% below the U.S. baseline), that statewide median translates to roughly $108,165 in nationally-comparable purchasing power. Highest-paying metros: Davenport ($104,320), Ames ($98,610), Dubuque ($96,383).
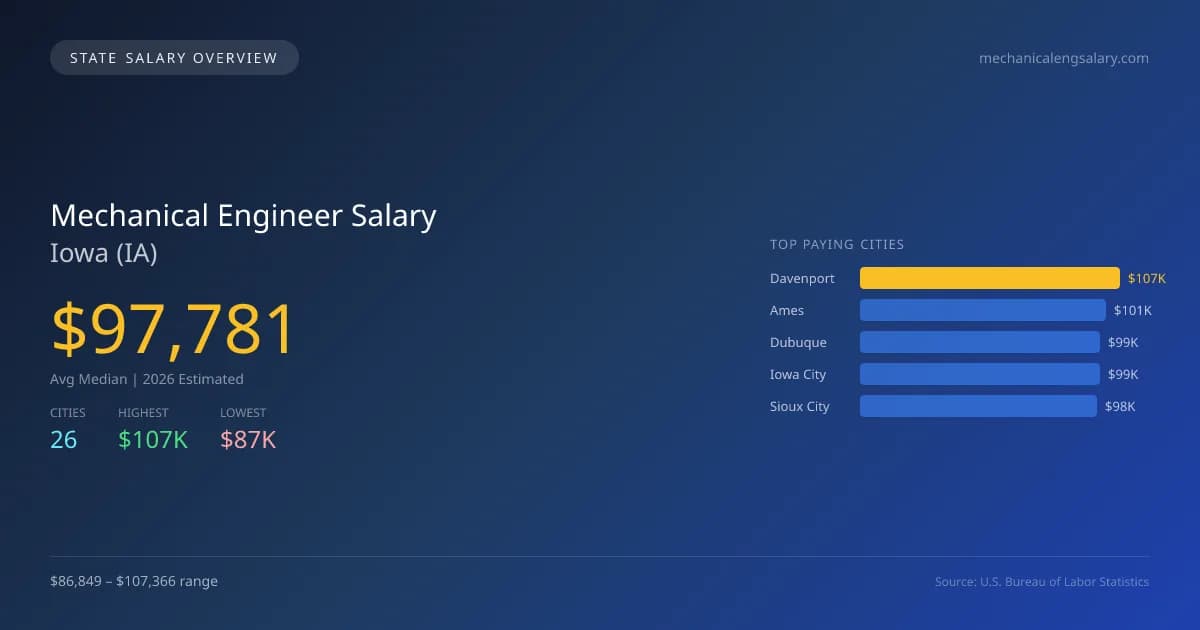
In 2026, mechanical engineers in Iowa are projected to earn an average median salary of $97,781, which is 8.7% lower than the national median of $107,150. The disparity in salaries among Iowa's cities is notable, with Davenport as the highest-paying city at $107,366, while West Des Moines offers the lowest average at $86,849, indicating a salary gap of $20,517. This difference can be attributed to factors such as local cost of living, demand for specific engineering skills, and the presence of key industries. Iowa has specific licensing requirements for engineers that necessitate adherence to state standards, influencing both the positive job outlook and salary scales. The projected growth rate in this field is 2.92%, driven by technological advancements and the need for sustainable engineering practices. With a total employment figure of 2,258 mechanical engineers, cities like Ames ($101,489), Dubuque ($99,197), Iowa City ($98,999), and Sioux City ($98,031) showcase competitive salaries. The demand for mechanical engineers remains strong in Iowa as industries expand, further enhancing job prospects for professionals in this field.
Iowa Mechanical Engineer Salary Range
Overall salary range in Iowa: $63,718 (lowest entry-level) to $153,756 (highest top earner)
Iowa vs National Average
Iowa mechanical engineers earn 8.74% less than the national median ($-9,369/year difference).
Iowa Mechanical Engineer Salary Distribution (2026)
Mechanical Engineer salaries in Iowa range from $74,958 (entry-level, 10th percentile) to $139,331 (top earners, 90th percentile), with a median of $97,781. The Iowa median is $9,369 below the US national median of $107,150. The average hourly rate is $47.01/hr. Approximately 2,258 mechanical engineers are employed across 26 cities.
2019 BLS Actual
$83,890
2025 BLS Actual
$95,007
2026 Current Est.
$97,781
2019–2027 Growth
+20.0%
Salary Trajectory for Mechanical Engineers in Iowa (2019–2027)
2019–2025: actual BLS OEWS data for this metro area. 2026+: CAGR 2.92% projection.
| Year | Annual Salary | Status |
|---|---|---|
| 2019 | $83,890 | Actual |
| 2020 | $81,474 | Actual |
| 2021 | $90,918 | Actual |
| 2022 | $93,175 | Actual |
| 2023 | $96,691 | Actual |
| 2024 | $93,712 | Actual |
| 2025 | $95,007 | Actual |
| 2026(current) | $97,781 | Estimated |
| 2027 | $100,636 | Projected |
Based on 7 years of BLS OEWS data for the Iowa metropolitan area, the median mechanical engineer salary grew 13.3% from $83,890 (2019) to $95,007 (2025). At a 2.92% compound annual growth rate, salaries are projected to reach $100,636 by 2027 — a total increase of $16,746 (19.96%) from 2019.
Note: Historical values (2019–2025) are actual BLS OEWS figures for the Iowa metropolitan area, sourced from annual Occupational Employment and Wage Statistics surveys. 2026–2026 figures are current estimates, and 2027 values are projections, calculated using a 2.92% CAGR derived from 7-year BLS historical data. Actual salaries may vary based on employer, experience, certifications, and local market conditions.
Top 5 Highest Paying Cities in Iowa
Lowest Paying Cities in Iowa
| City | Median Salary |
|---|---|
| West Des Moines | $86,849 |
| Cedar Rapids | $87,101 |
| Des Moines | $87,986 |
| Fort Dodge | $89,986 |
| Johnston | $90,988 |
Best Value Cities for Mechanical Engineers in Iowa
When adjusted for local cost of living, these Iowa cities offer the most purchasing power for mechanical engineers.
| City | Nominal Salary | CoL Index | Adjusted Salary |
|---|---|---|---|
| Davenport | $107,366 | 89.079 | $120,529 |
| Ames | $101,489 | 88.83 | $114,251 |
| Sioux City | $98,031 | 86.454 | $113,391 |
| Dubuque | $99,197 | 90.4 | $109,731 |
| Iowa City | $98,999 | 91.509 | $108,185 |
Adjusted salary = nominal salary × (100 / CoL index). CoL index: 100 = national average. Lower index = lower cost of living.
Salary by Experience Level in Iowa
| Experience Level | Estimated Annual |
|---|---|
| Entry Level (0-2 years) | $74,958 |
| Mid Career (3-7 years) | $97,781 |
| Experienced (7+ years) | $139,331 |
Estimates based on BLS percentile data averaged across Iowa metro areas. Individual pay varies by employer, certifications, and specialization.
All 26 Cities in Iowa
| # | City | Median Salary |
|---|---|---|
| 1 | Davenport | $107,366 |
| 2 | Ames | $101,489 |
| 3 | Dubuque | $99,197 |
| 4 | Iowa City | $98,999 |
| 5 | Sioux City | $98,031 |
| 6 | Marion | $96,395 |
| 7 | Ankeny | $95,269 |
| 8 | Council Bluffs | $94,671 |
| 9 | Burlington | $94,129 |
| 10 | Waukee | $93,790 |
| 11 | Urbandale | $93,664 |
| 12 | Bettendorf | $93,656 |
| 13 | Marshalltown | $93,367 |
| 14 | Cedar Falls | $93,310 |
| 15 | Coralville | $93,244 |
| 16 | Mason City | $92,812 |
| 17 | North Liberty | $92,448 |
| 18 | Clinton | $91,991 |
| 19 | Muscatine | $91,556 |
| 20 | Waterloo | $91,362 |
| 21 | Ottumwa | $91,210 |
| 22 | Johnston | $90,988 |
| 23 | Fort Dodge | $89,986 |
| 24 | Des Moines | $87,986 |
| 25 | Cedar Rapids | $87,101 |
| 26 | West Des Moines | $86,849 |
More Iowa Salary Data
Senior / Experienced
Top earner salaries for experienced mechanical engineers.
Explore More Mechanical Engineer Salary Data
Frequently Asked Questions
How much do mechanical engineers make in Iowa in 2026?
What is the highest paying city for mechanical engineers in Iowa?
How does Iowa mechanical engineer pay compare to the national average?
What is the entry-level mechanical engineer salary in Iowa?
How many mechanical engineers are employed in Iowa?
Which Iowa city offers the best value for mechanical engineers?
Written by Amina Patel, PE
Career Analyst
Amina has 10 years of experience in mechanical engineering. She specializes in thermal analysis and works in the automotive industry.
Methodology & Data Source
Statewide salary figures on this page are 2026 projections based on the Bureau of Labor Statistics Occupational Employment and Wage Statistics (OEWS) survey, May 2026 release. A 2.92% compound annual growth rate (CAGR), derived from 6-year national BLS wage trends, was applied to each metro area's reported salary to estimate current 2026 mechanical engineer compensation across Iowa. State averages are employment-weighted across 26 metro areas — larger metro areas with more mechanical engineerscontribute proportionally more to the average, producing figures that better reflect typical compensation. Individual pay varies by city, employer, certifications, and experience.
Data Sources & Methodology
Source: BLS, OEWS, 7-year dataset (–). Per-city data from annual BLS metropolitan area surveys.
2026 figures are projected from 2025 BLS data using a compound annual growth rate (CAGR) of 2.92%, derived from historical BLS wage trends for mechanical engineers (SOC 17-2141).
Compiled and verified by Amina Patel, PE, a licensed mechanical engineer with 10+ years of clinical experience. · View source data at BLS.gov