Mechanical Engineer Salary in New Jersey: $115,970 (2026)
Quick Answer:Across New Jersey's 61 metropolitan areas, the average median mechanical engineer pay sits at $115,970/year heading into 2026 — a figure projected from 2025 BLS OEWS wage data for SOC 17-2141. Because New Jersey sits at BEA RPP 115.2 (15% above the U.S. baseline), that statewide median translates to roughly $100,668 in nationally-comparable purchasing power. Highest-paying metros: East Orange ($121,590), Franklin ($121,590), Woodbridge ($121,556).
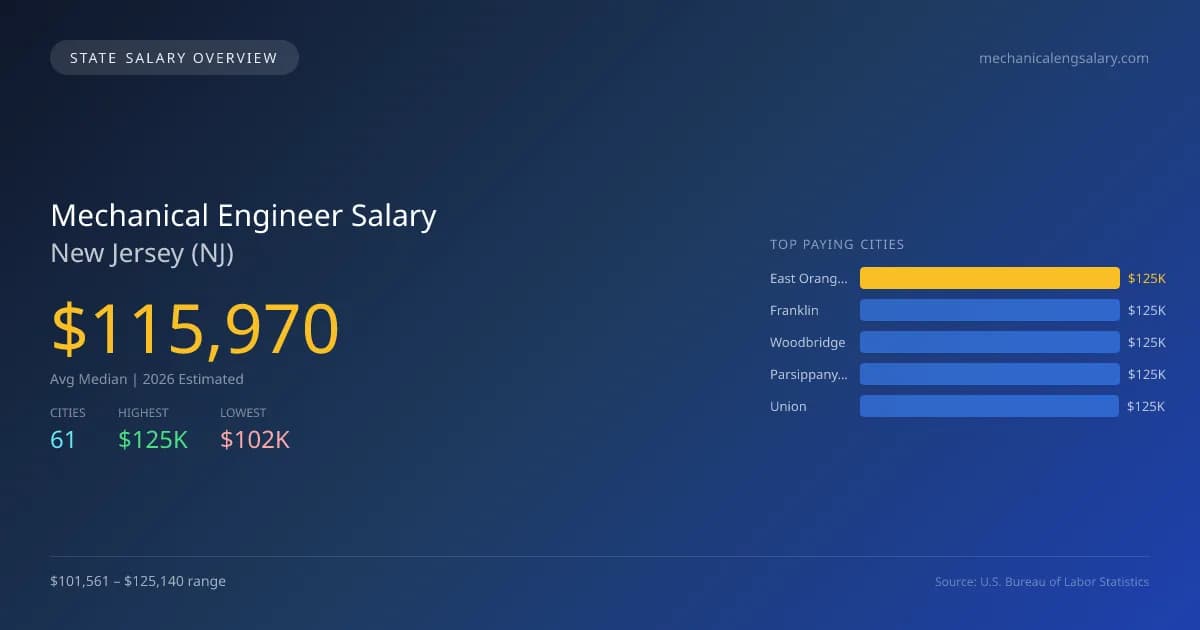
In New Jersey, mechanical engineer salaries are projected to average $115,970 in 2026, surpassing the national median of $107,150 by 8.2%. The salary range across the state shows significant variation; for instance, East Orange and Franklin lead with salaries of $125,140, while Atlantic City offers the lowest at $101,561, resulting in a gap of $23,579. This disparity can be attributed to factors such as the concentration of engineering firms, the cost of living, and regional industry demands. New Jersey has specific licensing requirements and scope of practice laws that often influence job qualifications and salaries. The state's diverse economy, including aerospace, pharmaceuticals, and manufacturing, drives strong demand for mechanical engineers. With a projected annual growth rate of 2.92%, the job market remains stable, supported by continuous advancements in technology and infrastructure projects. Currently, there are 1,083 mechanical engineers employed in New Jersey, with top-paying cities also including Woodbridge ($125,105), Parsippany-Troy Hills ($124,925), and Union ($124,612). The state's economy and its strategic location near major metropolitan areas add to its attractiveness for engineers seeking career opportunities.
New Jersey Mechanical Engineer Salary Range
Overall salary range in New Jersey: $65,015 (lowest entry-level) to $193,968 (highest top earner)
New Jersey vs National Average
New Jersey mechanical engineers earn 8.23% more than the national median (+$8,820/year difference).
New Jersey Mechanical Engineer Salary Distribution (2026)
Mechanical Engineer salaries in New Jersey range from $83,740 (entry-level, 10th percentile) to $178,318 (top earners, 90th percentile), with a median of $115,970. The New Jersey median is $8,820 above the US national median of $107,150. The average hourly rate is $55.75/hr. Approximately 1,083 mechanical engineers are employed across 61 cities.
2019 BLS Actual
$96,820
2025 BLS Actual
$112,680
2026 Current Est.
$115,970
2019–2027 Growth
+23.3%
Salary Trajectory for Mechanical Engineers in New Jersey (2019–2027)
2019–2025: actual BLS OEWS data for this metro area. 2026+: CAGR 2.92% projection.
| Year | Annual Salary | Status |
|---|---|---|
| 2019 | $96,820 | Actual |
| 2020 | $80,400 | Actual |
| 2021 | $95,539 | Actual |
| 2022 | $94,471 | Actual |
| 2023 | $92,892 | Actual |
| 2024 | $123,250 | Actual |
| 2025 | $112,680 | Actual |
| 2026(current) | $115,970 | Estimated |
| 2027 | $119,356 | Projected |
Based on 7 years of BLS OEWS data for the New Jersey metropolitan area, the median mechanical engineer salary grew 16.4% from $96,820 (2019) to $112,680 (2025). At a 2.92% compound annual growth rate, salaries are projected to reach $119,356 by 2027 — a total increase of $22,536 (23.28%) from 2019.
Note: Historical values (2019–2025) are actual BLS OEWS figures for the New Jersey metropolitan area, sourced from annual Occupational Employment and Wage Statistics surveys. 2026–2026 figures are current estimates, and 2027 values are projections, calculated using a 2.92% CAGR derived from 7-year BLS historical data. Actual salaries may vary based on employer, experience, certifications, and local market conditions.
Top 5 Highest Paying Cities in New Jersey
Lowest Paying Cities in New Jersey
| City | Median Salary |
|---|---|
| Atlantic City | $101,561 |
| Vineland | $102,529 |
| Trenton | $104,433 |
| Camden | $104,893 |
| Princeton | $106,509 |
Best Value Cities for Mechanical Engineers in New Jersey
When adjusted for local cost of living, these New Jersey cities offer the most purchasing power for mechanical engineers.
| City | Nominal Salary | CoL Index | Adjusted Salary |
|---|---|---|---|
| East Orange | $125,140 | 115.2 | $108,628 |
| Franklin | $125,140 | 115.2 | $108,628 |
| Woodbridge | $125,105 | 115.2 | $108,598 |
| Parsippany-Troy Hills | $124,925 | 115.2 | $108,442 |
| Union | $124,612 | 115.2 | $108,170 |
Adjusted salary = nominal salary × (100 / CoL index). CoL index: 100 = national average. Lower index = lower cost of living.
Salary by Experience Level in New Jersey
| Experience Level | Estimated Annual |
|---|---|
| Entry Level (0-2 years) | $83,740 |
| Mid Career (3-7 years) | $115,970 |
| Experienced (7+ years) | $178,318 |
Estimates based on BLS percentile data averaged across New Jersey metro areas. Individual pay varies by employer, certifications, and specialization.
All 61 Cities in New Jersey
| # | City | Median Salary |
|---|---|---|
| 1 | East Orange | $125,140 |
| 2 | Franklin | $125,140 |
| 3 | Woodbridge | $125,105 |
| 4 | Parsippany-Troy Hills | $124,925 |
| 5 | Union | $124,612 |
| 6 | Elizabeth | $124,567 |
| 7 | Brick | $124,310 |
| 8 | Gloucester Township | $123,958 |
| 9 | New Brunswick | $123,908 |
| 10 | Howell | $123,498 |
| 11 | Paterson | $123,350 |
| 12 | Plainfield | $123,205 |
| 13 | Irvington | $123,019 |
| 14 | West New York | $122,833 |
| 15 | Piscataway | $122,745 |
| 16 | Jackson | $122,677 |
| 17 | Lakewood | $122,473 |
| 18 | West Orange | $122,402 |
| 19 | Montclair | $122,220 |
| 20 | Washington Township | $122,028 |
| 21 | Old Bridge | $121,983 |
| 22 | Edison | $121,794 |
| 23 | Union City | $121,738 |
| 24 | Toms River | $121,699 |
| 25 | Bridgewater | $121,559 |
| 26 | Middletown | $121,523 |
| 27 | Clifton | $121,152 |
| 28 | South Brunswick | $120,936 |
| 29 | Berkeley | $120,927 |
| 30 | Perth Amboy | $120,907 |
| 31 | Wayne | $120,868 |
| 32 | Linden | $120,850 |
| 33 | Passaic | $120,820 |
| 34 | East Brunswick | $120,774 |
| 35 | Bloomfield | $120,516 |
| 36 | Long Branch | $120,438 |
| 37 | Westfield | $120,102 |
| 38 | Hamilton | $119,979 |
| 39 | Sayreville | $119,940 |
| 40 | Cherry Hill | $119,920 |
| 41 | North Bergen | $119,705 |
| 42 | Hoboken | $119,597 |
| 43 | Kearny | $119,413 |
| 44 | Manalapan | $119,308 |
| 45 | Bayonne | $119,187 |
| 46 | Manchester | $118,915 |
| 47 | Moorestown | $118,449 |
| 48 | Hackensack | $118,445 |
| 49 | Marlboro | $117,833 |
| 50 | Mount Laurel | $117,747 |
| 51 | Egg Harbor | $117,460 |
| 52 | Evesham | $117,287 |
| 53 | Rahway | $116,769 |
| 54 | Jersey City | $115,144 |
| 55 | Summit | $115,033 |
| 56 | Newark | $113,369 |
| 57 | Princeton | $106,509 |
| 58 | Camden | $104,893 |
| 59 | Trenton | $104,433 |
| 60 | Vineland | $102,529 |
| 61 | Atlantic City | $101,561 |
More New Jersey Salary Data
Hourly Rates
Explore mechanical engineer hourly pay in New Jersey cities.
Senior / Experienced
Top earner salaries for experienced mechanical engineers.
Explore More Mechanical Engineer Salary Data
Frequently Asked Questions
How much do mechanical engineers make in New Jersey in 2026?
What is the highest paying city for mechanical engineers in New Jersey?
How does New Jersey mechanical engineer pay compare to the national average?
What is the entry-level mechanical engineer salary in New Jersey?
How many mechanical engineers are employed in New Jersey?
Which New Jersey city offers the best value for mechanical engineers?
Written by Amina Patel, PE
Career Analyst
Amina has 10 years of experience in mechanical engineering. She specializes in thermal analysis and works in the automotive industry.
Methodology & Data Source
Statewide salary figures on this page are 2026 projections based on the Bureau of Labor Statistics Occupational Employment and Wage Statistics (OEWS) survey, May 2026 release. A 2.92% compound annual growth rate (CAGR), derived from 6-year national BLS wage trends, was applied to each metro area's reported salary to estimate current 2026 mechanical engineer compensation across New Jersey. State averages are employment-weighted across 61 metro areas — larger metro areas with more mechanical engineerscontribute proportionally more to the average, producing figures that better reflect typical compensation. Individual pay varies by city, employer, certifications, and experience.
Data Sources & Methodology
Source: BLS, OEWS, 7-year dataset (–). Per-city data from annual BLS metropolitan area surveys.
2026 figures are projected from 2025 BLS data using a compound annual growth rate (CAGR) of 2.92%, derived from historical BLS wage trends for mechanical engineers (SOC 17-2141).
Compiled and verified by Amina Patel, PE, a licensed mechanical engineer with 10+ years of clinical experience. · View source data at BLS.gov