Mechanical Engineer Salary in New Mexico: $104,100 (2026)
Quick Answer:Across New Mexico's 17 metropolitan areas, the average median mechanical engineer pay sits at $104,100/year heading into 2026 — a figure projected from 2025 BLS OEWS wage data for SOC 17-2141. Because New Mexico sits at BEA RPP 94.4 (6% below the U.S. baseline), that statewide median translates to roughly $110,275 in nationally-comparable purchasing power. Highest-paying metros: Albuquerque ($107,030), Rio Rancho ($101,157), Santa Fe ($99,231).
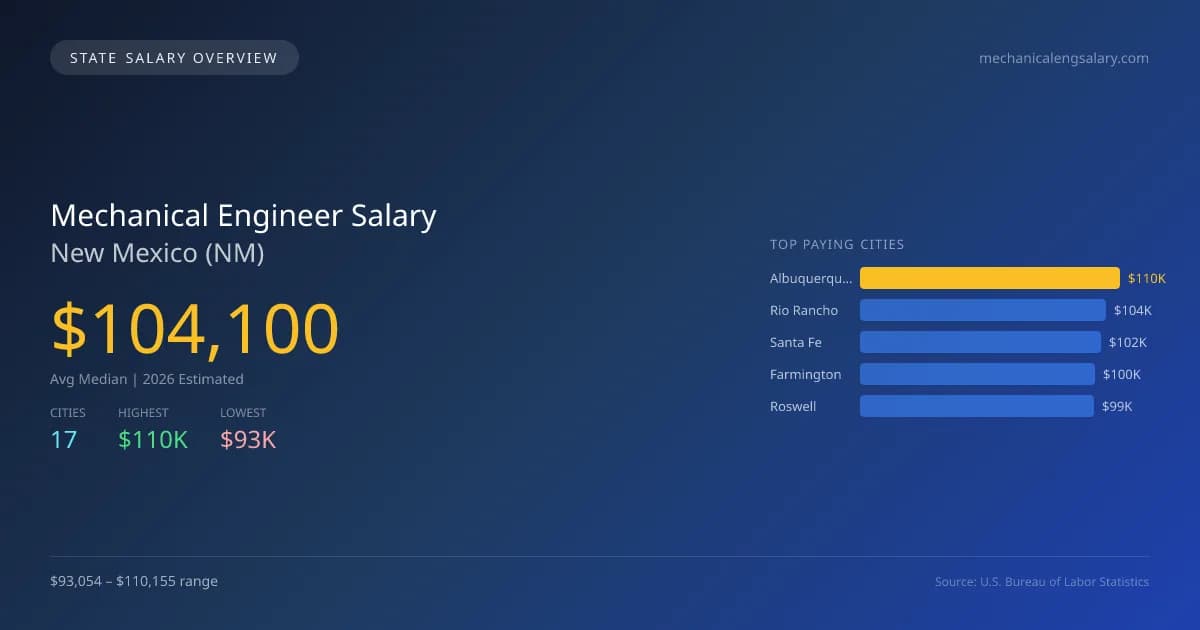
In New Mexico, the average median salary for mechanical engineers in 2026 is projected at $104,099, which is slightly below the national median of $107,150, indicating a difference of -2.8%. The highest paying city is Albuquerque, where salaries are estimated to reach $110,155, while Taos offers the lowest average at $93,054. This salary gap of $17,101 can be attributed to differences in the cost of living, local industry demand, and the concentration of engineering firms in urban areas. New Mexico's job market for mechanical engineers is showing promise, with a projected annual growth rate of 2.92%. State licensing requirements can influence employment opportunities, as engineers must be licensed to practice in many scenarios. Demand drivers include the state's focus on renewable energy projects and increasing infrastructure needs, particularly in urban centers. Key cities with projected salaries for 2026 include Rio Rancho at $104,111, Santa Fe at $102,129, Farmington at $99,689, and Roswell at $99,226. Understanding regional variances and projected trends will aid engineers in navigating their career paths in New Mexico.
New Mexico Mechanical Engineer Salary Range
Overall salary range in New Mexico: $67,833 (lowest entry-level) to $170,741 (highest top earner)
New Mexico vs National Average
New Mexico mechanical engineers earn 2.85% less than the national median ($-3,050/year difference).
New Mexico Mechanical Engineer Salary Distribution (2026)
Mechanical Engineer salaries in New Mexico range from $71,660 (entry-level, 10th percentile) to $160,161 (top earners, 90th percentile), with a median of $104,100. The New Mexico median is $3,050 below the US national median of $107,150. The average hourly rate is $50.05/hr. Approximately 229 mechanical engineers are employed across 17 cities.
2019 BLS Actual
$117,334
2025 BLS Actual
$101,146
2026 Current Est.
$104,100
2019–2027 Growth
+-8.7%
Salary Trajectory for Mechanical Engineers in New Mexico (2019–2027)
2019–2025: actual BLS OEWS data for this metro area. 2026+: CAGR 2.92% projection.
| Year | Annual Salary | Status |
|---|---|---|
| 2019 | $117,334 | Actual |
| 2020 | $119,443 | Actual |
| 2021 | $118,425 | Actual |
| 2022 | $85,320 | Actual |
| 2023 | $130,674 | Actual |
| 2024 | $93,925 | Actual |
| 2025 | $101,146 | Actual |
| 2026(current) | $104,100 | Estimated |
| 2027 | $107,140 | Projected |
Based on 7 years of BLS OEWS data for the New Mexico metropolitan area, the median mechanical engineer salary grew -13.8% from $117,334 (2019) to $101,146 (2025). At a 2.92% compound annual growth rate, salaries are projected to reach $107,140 by 2027 — a total increase of $-10,194 (-8.69%) from 2019.
Note: Historical values (2019–2025) are actual BLS OEWS figures for the New Mexico metropolitan area, sourced from annual Occupational Employment and Wage Statistics surveys. 2026–2026 figures are current estimates, and 2027 values are projections, calculated using a 2.92% CAGR derived from 7-year BLS historical data. Actual salaries may vary based on employer, experience, certifications, and local market conditions.
Top 5 Highest Paying Cities in New Mexico
Lowest Paying Cities in New Mexico
| City | Median Salary |
|---|---|
| Taos | $93,054 |
| Los Alamos | $93,229 |
| Los Lunas | $94,012 |
| Las Vegas | $94,028 |
| Gallup | $94,042 |
Best Value Cities for Mechanical Engineers in New Mexico
When adjusted for local cost of living, these New Mexico cities offer the most purchasing power for mechanical engineers.
| City | Nominal Salary | CoL Index | Adjusted Salary |
|---|---|---|---|
| Albuquerque | $110,155 | 94.4 | $116,690 |
| Rio Rancho | $104,111 | 94.4 | $110,287 |
| Las Cruces | $98,155 | 90.212 | $108,805 |
| Santa Fe | $102,129 | 94.4 | $108,187 |
| Farmington | $99,689 | 94.4 | $105,603 |
Adjusted salary = nominal salary × (100 / CoL index). CoL index: 100 = national average. Lower index = lower cost of living.
Salary by Experience Level in New Mexico
| Experience Level | Estimated Annual |
|---|---|
| Entry Level (0-2 years) | $71,660 |
| Mid Career (3-7 years) | $104,100 |
| Experienced (7+ years) | $160,161 |
Estimates based on BLS percentile data averaged across New Mexico metro areas. Individual pay varies by employer, certifications, and specialization.
All 17 Cities in New Mexico
| # | City | Median Salary |
|---|---|---|
| 1 | Albuquerque | $110,155 |
| 2 | Rio Rancho | $104,111 |
| 3 | Santa Fe | $102,129 |
| 4 | Farmington | $99,689 |
| 5 | Roswell | $99,226 |
| 6 | Alamogordo | $98,410 |
| 7 | Hobbs | $98,354 |
| 8 | Las Cruces | $98,155 |
| 9 | South Valley | $97,954 |
| 10 | Clovis | $96,055 |
| 11 | Carlsbad | $95,906 |
| 12 | Deming | $94,378 |
| 13 | Gallup | $94,042 |
| 14 | Las Vegas | $94,028 |
| 15 | Los Lunas | $94,012 |
| 16 | Los Alamos | $93,229 |
| 17 | Taos | $93,054 |
More New Mexico Salary Data
Hourly Rates
Explore mechanical engineer hourly pay in New Mexico cities.
Senior / Experienced
Top earner salaries for experienced mechanical engineers.
Explore More Mechanical Engineer Salary Data
Frequently Asked Questions
How much do mechanical engineers make in New Mexico in 2026?
What is the highest paying city for mechanical engineers in New Mexico?
How does New Mexico mechanical engineer pay compare to the national average?
What is the entry-level mechanical engineer salary in New Mexico?
How many mechanical engineers are employed in New Mexico?
Which New Mexico city offers the best value for mechanical engineers?
Written by Amina Patel, PE
Career Analyst
Amina has 10 years of experience in mechanical engineering. She specializes in thermal analysis and works in the automotive industry.
Methodology & Data Source
Statewide salary figures on this page are 2026 projections based on the Bureau of Labor Statistics Occupational Employment and Wage Statistics (OEWS) survey, May 2026 release. A 2.92% compound annual growth rate (CAGR), derived from 6-year national BLS wage trends, was applied to each metro area's reported salary to estimate current 2026 mechanical engineer compensation across New Mexico. State averages are employment-weighted across 17 metro areas — larger metro areas with more mechanical engineerscontribute proportionally more to the average, producing figures that better reflect typical compensation. Individual pay varies by city, employer, certifications, and experience.
Data Sources & Methodology
Source: BLS, OEWS, 7-year dataset (–). Per-city data from annual BLS metropolitan area surveys.
2026 figures are projected from 2025 BLS data using a compound annual growth rate (CAGR) of 2.92%, derived from historical BLS wage trends for mechanical engineers (SOC 17-2141).
Compiled and verified by Amina Patel, PE, a licensed mechanical engineer with 10+ years of clinical experience. · View source data at BLS.gov