Mechanical Engineer Salary in Richmond, VA: $107,171 (2026)
Quick Answer:A full-time mechanical engineer in Richmond, VA earns a median $107,171/year (≈ $51.52/hour) in nominal terms for 2026 — projected from BLS OEWS 2025 (SOC 17-2141). Once you factor in Richmond's price level (2% below national, BEA RPP 97.9), that paycheck buys what $109,517 would nationally. Nominal pay sits 3.8% above the Virginia state average.
Official BLS data · View source
In 2026, mechanical engineers in Richmond, Virginia, are projected to earn a median annual salary of $107,171, slightly edging out the national median of $107,150. This competitive figure reflects a robust market, particularly when considering the broader salary range of $76,151 at the lower end (P10) up to $143,882 for top earners (P90). The data, derived from 2025 BLS OEWS surveys and anticipated growth, is notably influenced by local industry dynamics. Companies like SpaceX and Tesla have notably reshaped compensation expectations in the aerospace and automotive sectors, pushing up the overall pay structure for engineers in Richmond. Given the continued demand for mechanical engineers in the area, the job market remains vibrant, offering diverse opportunities across various domains, which helps sustain competitive compensation packages.
Salary Breakdown
| Percentile | Annual | Hourly |
|---|---|---|
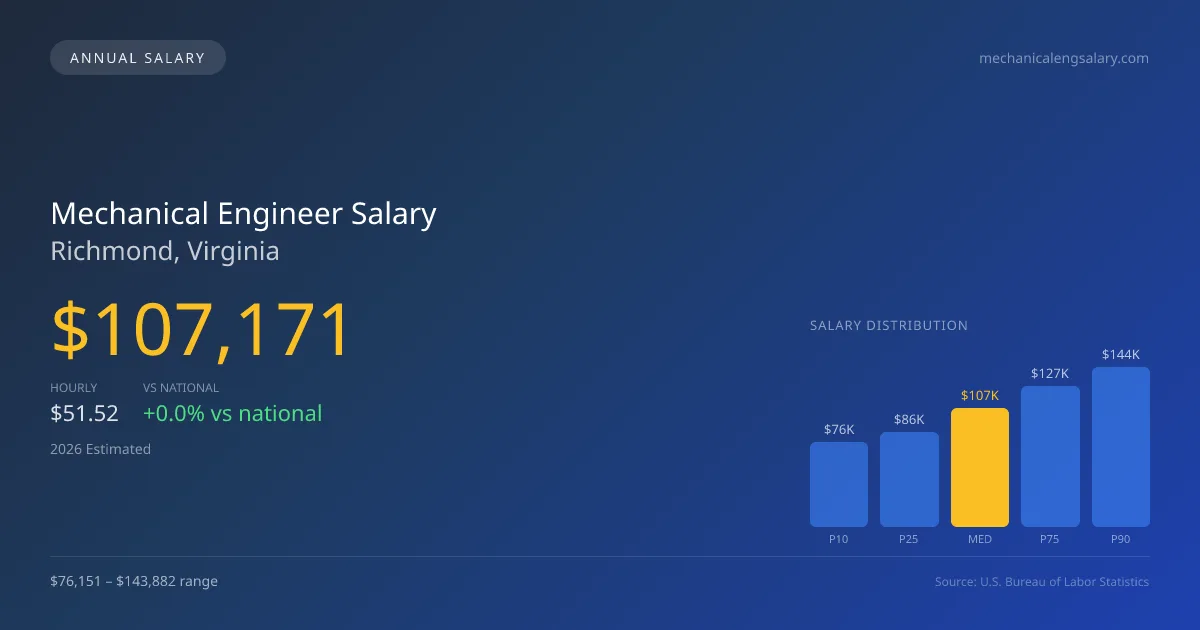
| Entry Level (P10) | $76,151 | $36.61 |
| Lower Range (P25) | $85,701 | $41.20 |
| Median (P50)(typical) | $107,171 | $51.52 |
| Upper Range (P75) | $126,983 | $61.05 |
| Top Earners (P90) | $143,882 | $69.17 |
Median Salary Position
0.02% above the national average
2026 Salary Percentile Distribution in Richmond
In Richmond, VA, the mechanical engineer salary spread from the 10th to 90th percentile is $67,731 (2026 est.). At $107,171, the local median is 0.02% above the national median of $107,150.
Salary Calculator
At 40 hours/week in Richmond: You'd be in the lower-middle range
How Richmond Mechanical Engineer Pay Compares
Richmond median: $107,171/year (2026)
| Compared To | Median Salary | Richmond Pays |
|---|---|---|
| Virginia Average | $103,247 | +3.80% more |
| National Average | $107,150 | +0.02% more |
Mechanical Engineers in Richmond, VA earn a median of $107,171 per year (2026 est.), which is 0.02% higher than the national median of $107,150 and 3.80% above the Virginia state average of $103,247.
Cost-of-Living Adjusted Salary
Richmond has a cost of living 2.14% below the national average, meaning your salary goes further here.
Adjusted salary = nominal × (100 / CoL index). CoL index: 100 = national average.
Richmond, VA has a cost-of-living index of 97.858 (below the national average of 100). A mechanical engineer earning $107,171 nominally has purchasing power equivalent to $109,517 in an average-cost city — an effective 2.19% boost.
Compare Purchasing Power
Select a city to see how your salary compares after cost of living
Select a city above to compare purchasing power
2019 BLS Actual
$89,940
2025 BLS Actual
$104,130
2026 Current Est.
$107,171
2019–2027 Growth
+22.6%
Salary Trajectory for Mechanical Engineers in Richmond (2019–2027)
2019–2025: actual BLS OEWS data for this metro area. 2026+: CAGR 2.92% projection.
| Year | Annual Salary | Status |
|---|---|---|
| 2019 | $89,940 | Actual |
| 2020 | $87,270 | Actual |
| 2021 | $82,770 | Actual |
| 2022 | $93,770 | Actual |
| 2023 | $93,240 | Actual |
| 2024 | $101,210 | Actual |
| 2025 | $104,130 | Actual |
| 2026(current) | $107,171 | Estimated |
| 2027 | $110,300 | Projected |
Based on 7 years of BLS OEWS data for the Richmond metropolitan area, the median mechanical engineer salary grew 15.8% from $89,940 (2019) to $104,130 (2025). At a 2.92% compound annual growth rate, salaries are projected to reach $110,300 by 2027 — a total increase of $20,360 (22.64%) from 2019.
Note: Historical values (2019–2025) are actual BLS OEWS figures for the Richmond metropolitan area, sourced from annual Occupational Employment and Wage Statistics surveys. 2026–2026 figures are current estimates, and 2027 values are projections, calculated using a 2.92% CAGR derived from 7-year BLS historical data. Actual salaries may vary based on employer, experience, certifications, and local market conditions.
Salary by Experience Level
| Experience | Estimated Salary Range |
|---|---|
| 0-2 years (New Graduate) | $76,151 – $85,701 |
| 3-5 years (Mid Career) | $85,701 – $107,171 |
| 5+ years (Experienced) | $107,171 – $126,983 |
| 10+ years (Top Earner) | $126,983 – $143,882 |
ME, PE salary ranges estimated from BLS percentile data. Individual mechanical engineer compensation varies by employer, certifications, and specialization.
Mechanical Engineer Job Market in Richmond
Richmond's job market for mechanical engineers features approximately 640 professionals working in the field, providing a stable employment base. The cost of living in Richmond, with an index of 97.858, suggests that take-home purchasing power will remain relatively strong, enhancing the attractiveness of local salaries. Industries such as aerospace and defense, particularly firms like Boeing and Lockheed Martin, tend to offer higher compensation due to the specialized skills required, including potential security clearances. In contrast, mechanical engineers in the HVAC sector may benefit from ongoing demand and pathways to professional licensure, which can influence pay rates. To maximize pay in this Richmond market, engineers should consider pursuing advanced certifications, networking within the burgeoning EV and aerospace sectors, and weighing opportunities that provide equity or RSUs, especially at tech-related companies. This strategic approach can help bridge the gap between entry-level and senior positions, ultimately enhancing overall earning potential.
More salary data for Richmond, VA:
Frequently Asked Questions
How much do mechanical engineers make in Richmond, VA in 2026?
Is Richmond, VA a good place to work as a mechanical engineer?
Can mechanical engineers make $100K in Richmond?
What is the cost-of-living adjusted mechanical engineer salary in Richmond?
How much does a mechanical engineer make per hour in Richmond?
Related Pages
Compare Salaries
Career Resources
Nearby Cities in Virginia
Written by Amina Patel, PE
Career Analyst
Amina has 10 years of experience in mechanical engineering. She specializes in thermal analysis and works in the automotive industry.
Methodology & Data Source
Salary figures on this page are 2026 projections based on the Bureau of Labor Statistics Occupational Employment and Wage Statistics (OEWS) survey, May 2026 release. The BLS reported a median annual salary of $104,130 for mechanical engineersin the Richmond metropolitan area. A 2.92% compound annual growth rate (CAGR), calculated from 6-year national BLS wage trends, was applied to project current 2026 compensation. Percentile ranges (P10–P90) represent the full salary distribution across experience levels and practice settings in this market.
Data Sources & Methodology
Source: BLS, OEWS, 7-year dataset (–). Per-city data from annual BLS metropolitan area surveys.
2026 figures are projected from 2025 BLS data using a compound annual growth rate (CAGR) of 2.92%, derived from historical BLS wage trends for mechanical engineers (SOC 17-2141).
Compiled and verified by Amina Patel, PE, a licensed mechanical engineer with 10+ years of clinical experience. · View source data at BLS.gov