Mechanical Engineer Salary in Richland, WA: $131,099 (2026)
Quick Answer:A full-time mechanical engineer in Richland, WA earns a median $131,099/year (≈ $63.03/hour) in nominal terms for 2026 — projected from BLS OEWS 2025 (SOC 17-2141). Once you factor in Richland's price level (7% above national, BEA RPP 107.4), that paycheck buys what $122,066 would nationally. Nominal pay sits 18.4% above the Washington state average.
Based on BLS state-level estimates · View source
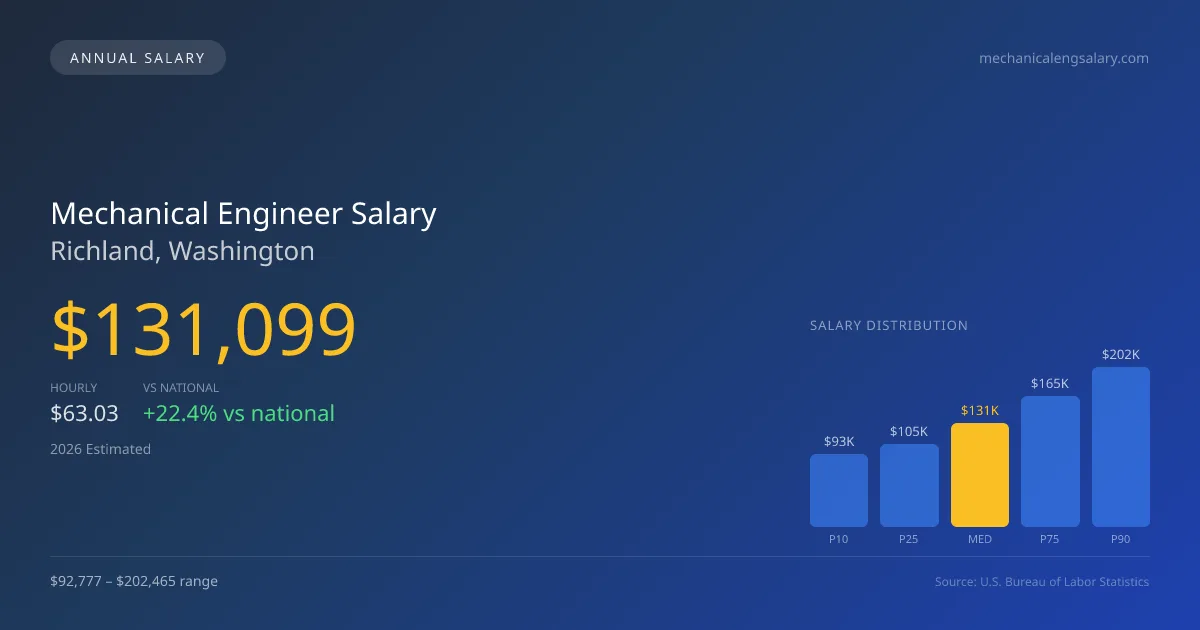
In 2026, mechanical engineers in Richland, Washington, can expect a median annual salary of $131,099, significantly above the national average of $107,150. The salary range spans from $92,777 at the 10th percentile to $202,465 at the 90th percentile, illustrating the potential for substantial earnings based on experience and specialization. Local estimates, derived from 2025 BLS data and adjusted for regional price parity, highlight Richland's competitive compensation landscape. Given the strong presence of companies like SpaceX and Tesla in the vicinity, equity and RSU compensation models have reshaped expectations, often elevating total compensation packages beyond basic salaries. The robust job market also indicates healthy demand for mechanical engineers, suggesting promising career prospects.
About the Richland Market
Salary estimated from Washington average ($118,000) adjusted for local cost of living.
Salary Breakdown
| Percentile | Annual | Hourly |
|---|---|---|
| Entry Level (P10) | $92,777 | $44.61 |
| Lower Range (P25) | $104,662 | $50.32 |
| Median (P50)(typical) | $131,099 | $63.03 |
| Upper Range (P75) | $165,258 | $79.45 |
| Top Earners (P90) | $202,465 | $97.34 |
Median Salary Position
22.35% above the national average
2026 Salary Percentile Distribution in Richland
In Richland, WA, the mechanical engineer salary spread from the 10th to 90th percentile is $109,688 (2026 est.). At $131,099, the local median is 22.35% above the national median of $107,150.
Salary Calculator
At 40 hours/week in Richland: You'd be in the lower-middle range
How Richland Mechanical Engineer Pay Compares
Richland median: $131,099/year (2026)
| Compared To | Median Salary | Richland Pays |
|---|---|---|
| Washington Average | $110,726 | +18.40% more |
| National Average | $107,150 | +22.35% more |
Mechanical Engineers in Richland, WA earn a median of $131,099 per year (2026 est.), which is 22.35% higher than the national median of $107,150 and 18.40% above the Washington state average of $110,726.
Cost-of-Living Adjusted Salary
Richland has a cost of living 7.40% above the national average.
Adjusted salary = nominal × (100 / CoL index). CoL index: 100 = national average.
Richland, WA has a cost-of-living index of 107.4 (above the national average of 100). While the nominal salary of $131,099 is competitive, the higher cost of living reduces purchasing power to an effective $122,066 — a 6.89% reduction.
Compare Purchasing Power
Select a city to see how your salary compares after cost of living
Select a city above to compare purchasing power
2019 BLS Actual
$108,195
2025 BLS Actual
$127,380
2026 Current Est.
$131,099
2019–2027 Growth
+24.7%
Salary Trajectory for Mechanical Engineers in Richland (2019–2027)
2019–2025: actual BLS OEWS data for this metro area. 2026+: CAGR 2.92% projection.
| Year | Annual Salary | Status |
|---|---|---|
| 2019 | $108,195 | Actual |
| 2020 | $110,312 | Actual |
| 2021 | $116,601 | Actual |
| 2022 | $117,837 | Actual |
| 2023 | $121,752 | Actual |
| 2024 | $128,079 | Actual |
| 2025 | $127,380 | Actual |
| 2026(current) | $131,099 | Estimated |
| 2027 | $134,928 | Projected |
Based on 7 years of BLS OEWS data for the Richland metropolitan area, the median mechanical engineer salary grew 17.7% from $108,195 (2019) to $127,380 (2025). At a 2.92% compound annual growth rate, salaries are projected to reach $134,928 by 2027 — a total increase of $26,733 (24.71%) from 2019.
Note: Historical values (2019–2025) are actual BLS OEWS figures for the Richland metropolitan area, sourced from annual Occupational Employment and Wage Statistics surveys. 2026–2026 figures are current estimates, and 2027 values are projections, calculated using a 2.92% CAGR derived from 7-year BLS historical data. Actual salaries may vary based on employer, experience, certifications, and local market conditions.
Salary by Experience Level
| Experience | Estimated Salary Range |
|---|---|
| 0-2 years (New Graduate) | $92,777 – $104,662 |
| 3-5 years (Mid Career) | $104,662 – $131,099 |
| 5+ years (Experienced) | $131,099 – $165,258 |
| 10+ years (Top Earner) | $165,258 – $202,465 |
ME, PE salary ranges estimated from BLS percentile data. Individual mechanical engineer compensation varies by employer, certifications, and specialization.
Mechanical Engineer Job Market in Richland
In Richland, where about 15 mechanical engineers are currently employed, understanding the local job market dynamics is crucial. The cost of living index sits at 107.4, suggesting that while salaries are higher than the national average, the purchasing power may be relatively less impactful. Top employers in this area, particularly in aerospace and automotive sectors, play a significant role in driving salaries. Companies like Boeing and SpaceX typically offer the highest compensation packages, which include equity options, catering to the increasing importance of specialized skills. The variance in pay stems from industry focus, the value of obtaining a PE license within HVAC and building systems, security clearance premiums in defense roles, and the choice between technical and management career paths. For those seeking to maximize earnings in Richland, building expertise in in-demand sectors and pursuing advanced licenses will be essential strategies for career advancement.
More salary data for Richland, WA:
Frequently Asked Questions
How much do mechanical engineers make in Richland, WA in 2026?
Is Richland, WA a good place to work as a mechanical engineer?
Can mechanical engineers make $100K in Richland?
What is the cost-of-living adjusted mechanical engineer salary in Richland?
How much does a mechanical engineer make per hour in Richland?
Related Pages
Compare Salaries
Career Resources
Nearby Cities in Washington
Written by Amina Patel, PE
Career Analyst
Amina has 10 years of experience in mechanical engineering. She specializes in thermal analysis and works in the automotive industry.
Methodology & Data Source
Salary figures on this page are 2026 projections based on the Bureau of Labor Statistics Occupational Employment and Wage Statistics (OEWS) survey, May 2026 release. The BLS reported a median annual salary of $127,380 for mechanical engineersin the Richland metropolitan area. A 2.92% compound annual growth rate (CAGR), calculated from 6-year national BLS wage trends, was applied to project current 2026 compensation. Percentile ranges (P10–P90) represent the full salary distribution across experience levels and practice settings in this market.
Data Sources & Methodology
Salary data for Richland is estimated from official BLS state-level occupational wage data (2025), adjusted for regional cost-of-living differences using BEA RPP (Regional Price Parities).
2026 figures are projected from 2025 BLS data using a compound annual growth rate (CAGR) of 2.92%, derived from historical BLS wage trends for mechanical engineers (SOC 17-2141).
Compiled and verified by Amina Patel, PE, a licensed mechanical engineer with 10+ years of clinical experience. · View source data at BLS.gov